Pie charts and a diagram:
Hello everyone
The one hour Writing task is divided into two tasks in both Academic and General Training modules.
For Academic Task 1, Candidates are required to write a report based on a visual image like: graph or a map or a diagram. This detail should be at least 150 words and completed within 20 minutes. However, in General training Task-1, candidates must write a letter of at least 150 words within 20 minutes.
Today we will discuss writing task 1. I will provide you two sample answers of given pie charts and a diagram as well as some tips regarding them.
STEPS TO MASTER THE TASK:You should follow these steps to prepare yourself for Task 1:
Task 1 has variety of graphic forms like: line graph, bar graph, pie chart, table,map, process, flow chart.Learn to recognize and identify all these.
Read and see the information properly then organize, present and compare the data. Write information as well as comparison.
Practice regularly using the specific vocabulary and connecting words required to describe the trends. Learn how to follow a plan to start, complete and finish your answer.
At first ,do not time yourself.Later, once you have got the idea and it's format, time yourself and make sure you finish in 20 minutes. Practice all the types of tasks and be specific about word limit.
Always count words of your writing by line (have an idea about average words in one line then count lines). This will save your time in writing exam.
IELTS Tip: Writing Task 1
1) Spend a few minutes planning the organization of your answer and the content of each paragraph.
2) If there are large amount of data, divide it into categories so that you express the main features, but not every detail.
3) Leave time to check your work for mistakes.
You should spend about 20 minutes on this task.
The two pie charts below show some employment patterns in Great Britain in 1992.
Summarise the information by selecting and reporting the main features, and make comparisons where relevant.
Write at least 150 words.
Employees and self-employed: by genders and occupation, 1992
Model answer
The charts provide information on the proportion of males and females in employment in 6 broad categories, divided into manual and non-manual occupations. In general, a greater percentage of women work in non-manual occupations than work in manual occupations, and the reverse is true for men.
In the non-manual occupations, while a greater percentage of working women than men are found in clerical-type positions, there is a smaller percentage of women than men employed in managerial and professional positions. The percentage of women employed in other non-manual occupations is slightly larger than the percentage of men in these occupations.
In manual employment, the biggest difference between the two sexes is in the employment of craft workers, where males make up 24% of the workforce and females just 3%. Furthermore, the percentage of women working as general working as general labourer is very small, only 1%. There is not a great deal of difference between the percentage of men doing other forms of manual work (26%) and women in other manual work (27%).
In summary, the two charts clearly show that women do not have the same access as men to certain types of employment.
(194 words)
Test Tip
For IELTS Task 1 you may have to describe a physical process. This may be illustrated in the form of a diagram showing the different steps or stages in the process. In a process description some verbs will be in the passive and some in the active.
You should spend about 20 minutes on this task.
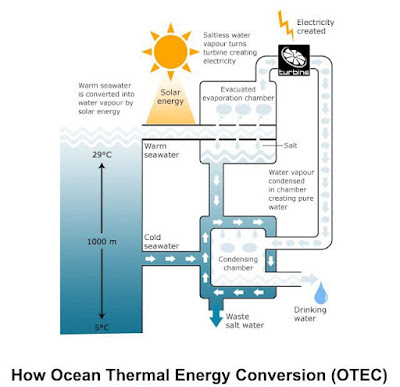
The diagram below shows the production of electricity using a system called Ocean Thermal Energy Conversion (OTEC).
Write a report for a university lecturer describing the information below.
Write at least 150 words.
Model answer
Ocean thermal energy conversion (OTEC) is a system that converts heat energy into the electric power using the temperature difference between surface seawater, which can be up to 29 degrees Celsius, and deep seawater, which is only 5 degrees Celsius.
The main components of the system are an evacuated evaporation chamber, a turbine and a condensing chamber. The solar energy of the sun heats up the surface water and this warm water is introduced into the evacuated evaporation chamber, where it boils. As it boils, salt is deposited and water vapour is generated. This vapour then drives a turbine to generate electricity. After it powers the turbine, the water vapour enters the condensing chamber, which is cooled by the water from the depths of the ocean. The water vapour is condensed in this chamber, producing drinking water. Meanwhile, waste salt water is discharged into the ocean and the process can be repeated.
(152 words)
Improve your English writing skills
Make sure you know how to use percent and percentage.
• percent comes after a number.
• percentage comes after words like the, a, this, that, etc. and is often preceded by an adjective, e.g. A high percentage of customers…
• Both go with the preposition of.
When writing numbers or percentages, use words up to the number ten, e.g. eight per cent, and then figures, e.g. 12 percent. However, always write a number at the beginning of a sentence in words, e.g. Twelve percent…
I hope guys this article will help you to improve your writing skills in task 1. I will soon post all vocabulary related to task 1.so guys stay connected!
you can subscribe to our website www.learngrammarforielts.com for further updations. you can also like our Facebook page learn grammar for IELTs
www.facebook.com/learning989
THANK YOU FOR YOUR SUPPORT
RAMANDEEP KAUR


.jpg)
